
A research group made up of Associate Professor Dai Yamazaki and Project Assistant Professor Xudong Zhou of the Institute of Industrial Science, The University of Tokyo, Chief Researcher Wataru Echizenya of MS&AD InterRisk Research and Consulting, Inc., and others has determined that the main cause of uncertainties in wide-area flood hazard maps, which are derived from multi-step calculations and the results of data processing, lies in the runoff volume data input into river flood models. This research was published in Natural Hazard and Earth System Science.
Flood damage due to increased water in rivers is one of the main natural disasters found all around the world. Developed countries maintain flood hazard maps that reflect detailed river management conditions, etc. in watersheds, but there are many areas around the world in which local governments do not adequately maintain hazard maps. International research institutions and other organizations in these areas create wide-area flood hazard maps based on flood simulations that target a wide area, and these are used by both the public sector and private businesses to determine disaster-prevention plans and business continuity plans.
However, to construct a wide-area flood hazard map via flood simulations, researchers need to carry out multi-step calculations and data processing, including collecting and maintaining climate data, simulations based on rainfall-runoff models and river flow-flood models, and extreme value statistical analysis of input-output data to be input into models. Consequently, it was hard to identify where the cause of an error may be, and difficult to quantitatively assess the accuracy and uncertainty of wide-area flood hazard maps.
The research team has developed a flood model called CaMa-Flood, which targets all regions of the world. For this research, the team focused on assessing uncertainties indicated in wide-area flood hazard maps by carrying out numerous flood simulations using this model.
To identify the main causes of errors in the process of constructing hazard maps across multiple stages, the team used runoff volume data calculated from seven types of rainfall-runoff models as the input data for CaMa-Flood to carry out flood simulations. They then applied extreme value distribution functions that are different for every model output variant (2 variables × 6 types), and estimated the depth of the flood for each flood scale in random sites on Earth in a form that included a range of uncertainty.
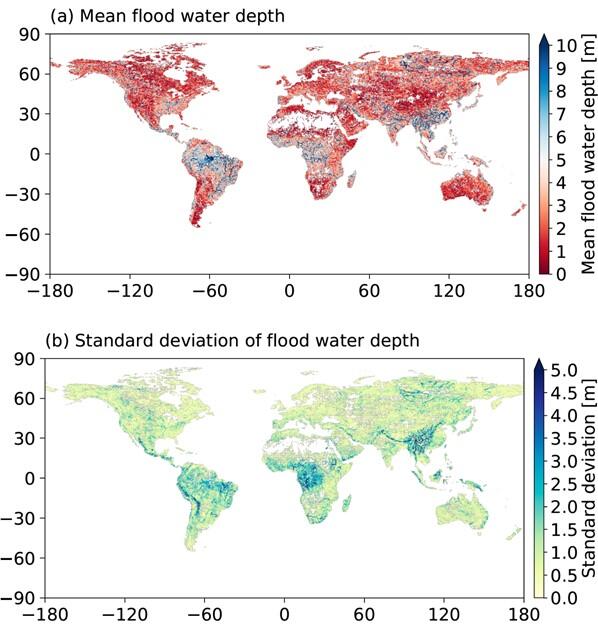
As a result, the team learned that, for example, if there is flooding with a frequency level of once in 100 years, the average flood water depth on any floodplains near major rivers or lakes would be great, and that there is a tendency for variation in flood water depth to increase in mountainous or semi-arid areas. In mountainous areas, this is thought to be because the terrain is steep, and so the water-level simulations are sensitive to changes in input runoff volume, and in semi-arid areas this is believed to be because it is difficult to formulate rainfall-runoff processes and estimate parameters, so the uncertainty in a model increases.
Moreover, for each different flood scale the team estimated whether the flood water depth ranges that they obtained were due to variation in runoff volume data, or due to differences in the extreme value statistical analysis methods used. The results showed that the majority of the variation in flood water depth could be explained by uncertainty in the input runoff volume data. However, in the case of low-frequency large-scale floods that occur once every 200 years, the team found that the lack of past climate data samples meant that the effects of the differences in extreme value statistical functions could no longer be ignored.
These outcomes suggest that, by analyzing the accuracy of and selecting runoff volume data to be input using observations of river flow rates, there is a possibility of drastically improving the reliability of flood hazard maps, and that we need clever ways to improve the accuracy of our estimations of low-frequency floods, such as extending simulation times using output from climate models, etc.
The research group is moving on with its study on ways to use hazard maps based on the assumption that they include uncertainties, as well as continuing its research to make climate data, rainfall-runoff models, and flood models more accurate, and focusing its efforts on generating flood risk information that is more reliable and easy to use.
This article has been translated by JST with permission from The Science News Ltd.(https://sci-news.co.jp/). Unauthorized reproduction of the article and photographs is prohibited.