
A research group consisting of Shingo Watanabe, Deputy Director of the Research Center for Environmental Modeling and Application (CEMA), Research Institute for Global Change (RIGC), the Japan Agency for Marine-Earth Science and Technology (JAMSTEC), Visiting Researcher Shunsuke Noguchi, PhD student Dai Koshin and Professor Kaoru Sato of the Graduate School of Science, the University of Tokyo, has succeeded in clarifying the characteristic morphology of atmospheric gravity waves (GWs), which dramatically transform around the polar vortex, through detailed simulations and visualization of the GWs during a sudden stratospheric warming. GWs have a major effect on atmospheric general circulation; they are a kind of oscillation created when the atmosphere is shaken up and down by various mechanisms and propagate through the atmosphere in three dimensions, but it was not possible to clarify their lives due to the constraints of observational techniques.
Provided by JAMSTEC
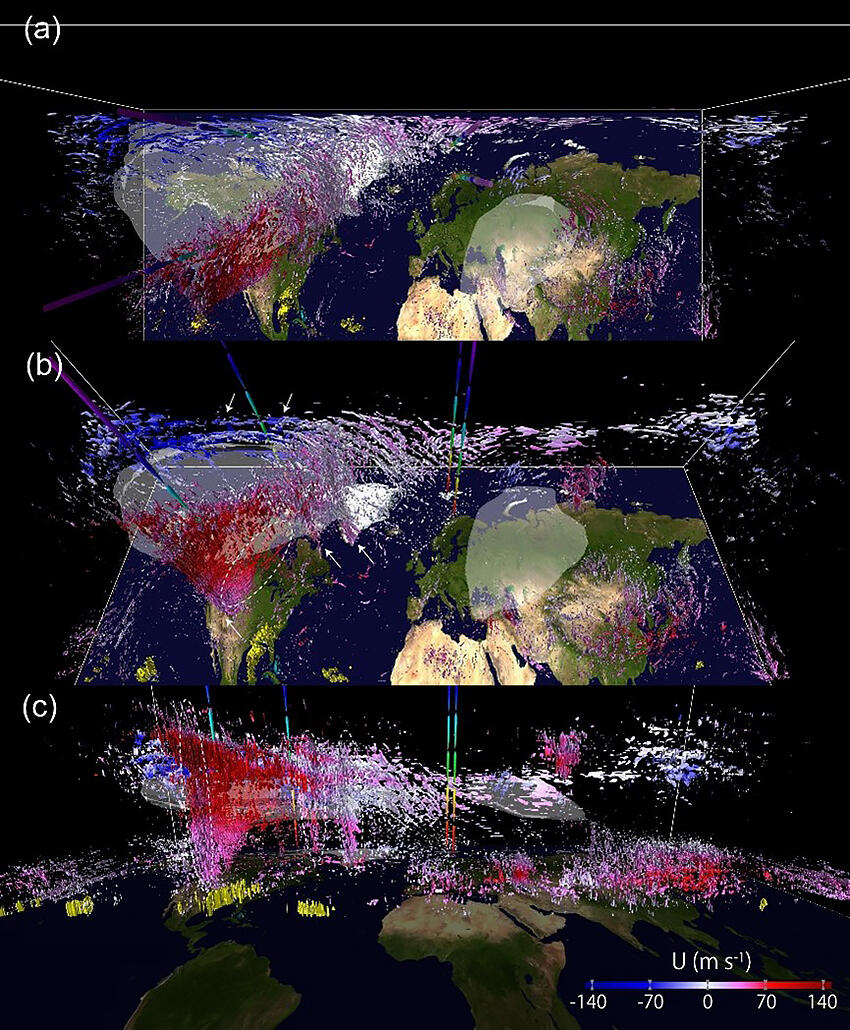
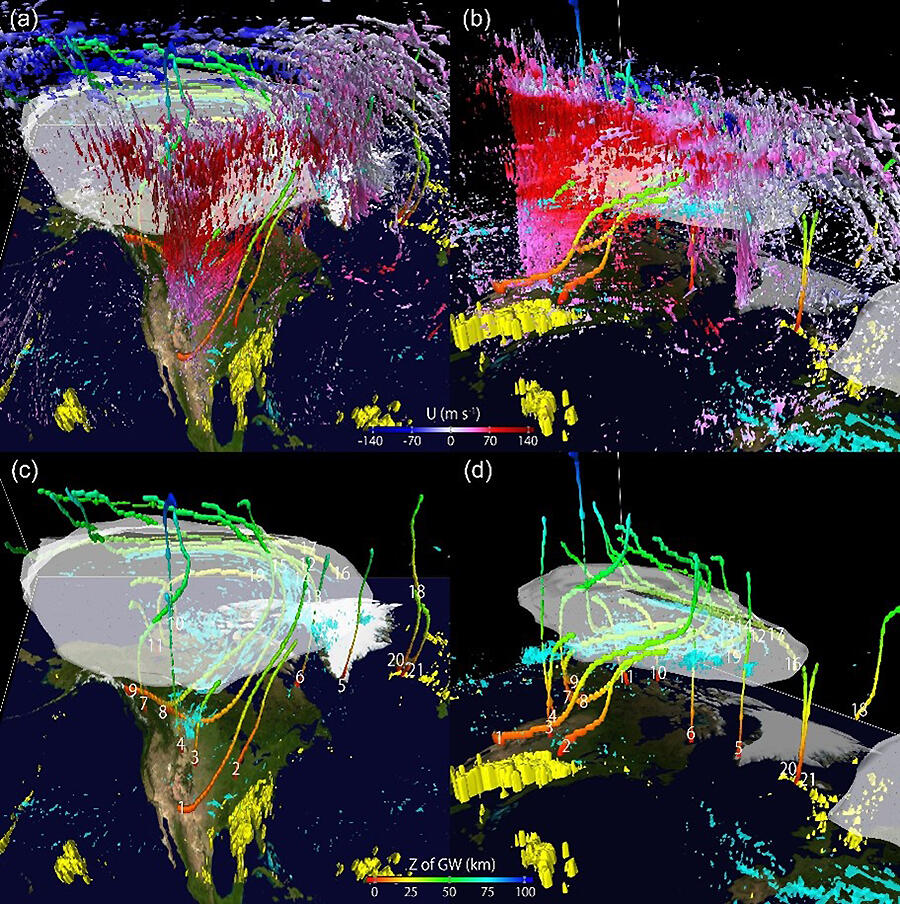
The research group aimed to visualize gravity waves of various morphologies obtained from detailed simulations, as if seeing them from space, and estimated their propagation pathways by combining 3D images and ray tracing analysis. By carrying out detailed simulations and visualization of GWs during the sudden stratospheric warming that occurred in February 2018, they clarified the characteristic morphology of the dramatically changing GWs around the polar vortex. They obtained a new image of GWs passing through much longer distances than expected, showing them traveling over a distance of several thousand kilometers along the peripheral areas of the polar vortex in the North American skies with wide counterclockwise rotation as they rise, scattering as they reach an altitude of 50-70 km.
Provided by JAMSTEC
The research outcomes the group has obtained suggest that the conventional hypothesis that the GWs generated almost all propagate directly upwards does not hold in many cases, and that GWs propagated from unlikely locations can transfer momentum carried at unexpected times to the surrounding atmosphere, causing sudden changes in the winds of the stratosphere and mesosphere and a mixing of substances. Watanabe commented, "Based on these new images of the 3D long-distance propagation of gravity waves, we will clarify unknown remote influences using their momentum transport, which will lead to rewriting textbooks for atmospheric science, and contribute to improving weather prediction models, etc. We want to explain unknown and unclear atmospheric science events by developing our simulations and visualization methods."
■ Ray tracing analysis: An analysis method that estimates the propagation path of GWs using equations that combine the intrinsic parameters of GWs (horizontal wavelength, vertical wavelength, horizontal phase speed, vertical phase speed, period, etc.) and the rate at which the parameters of the atmosphere surrounding the GWs (calculated based on the wind, temperature, etc.) vary in space.
■ Polar vortex: The stratospheric and mesospheric north and south polar regions are covered by huge, cold cyclones from late fall to spring. Strong westerly winds blow at the edges of these cyclones. Together, these cold cyclones and the westerly winds that blow around them are called polar vortexes. Polar vortexes aren't stable through the seasons, and they often deform. In the middle of February 2018, the polar vortex deformed so greatly that it split into two.
Journal Information
Publication: JGR: Atmospheres
Title: Gravity Wave Morphology During the 2018 Sudden Stratospheric Warming Simulated by a Whole Neutral Atmosphere General Circulation Model
DOI: 10.1029/2022JD036718
This article has been translated by JST with permission from The Science News Ltd.(https://sci-news.co.jp/). Unauthorized reproduction of the article and photographs is prohibited.