This is the final installment in a series of stories in which Yutaka Minagawa, a young employee of a trading company reads and analyzes proposal papers by the Center for Low Carbon Society Strategy (LCS). In this issue, he interprets the extended input‐output tables developed by LCS and talks with Research Advisor Koichi Yamada, Senior Researcher Tamaki Ishikawa, and Researcher Hiroshi Nishikawa about the necessary steps for Japan to achieve an affluent, zero‐emission society.
Displaying industry connections in monetary terms through a unique, easy‐to‐understand system
Minagawa: I'm finally at the end of my project. I wanted to talk to you today because I heard that your research results reveal a specific vision of a decarbonized future.
Yamada: Research to achieve decarbonization by 2050 is progressing worldwide. Our study quantitatively illustrates the possibility of achieving zero carbon (ZC) while maintaining economic prosperity by examining future transformations in industrial structures.
Minagawa: It's often said there must be a trade‐off between the environment and the economy, but can they be mutually compatible?
Yamada: If we develop each industry and strengthen international competitiveness, there is a good chance we can achieve ZC while producing a bright and affluent society.
Minagawa: That sounds hopeful! Tell me more. Firstly, what do you mean by quantitative?
Yamada: As a novel approach to quantitatively depicting a society that has achieved ZC, we created extended input‐output tables to calculate future GDP, electricity demand, and CO2 emissions.
Minagawa: What kind of table is that?
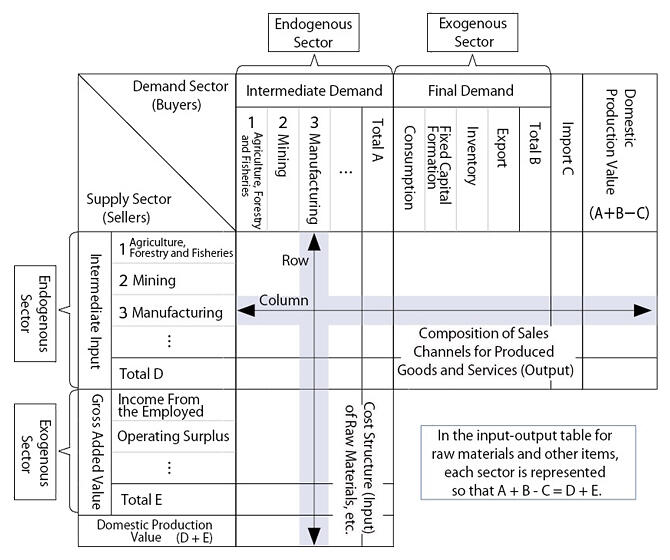
Ishikawa: The Ministry of Internal Affairs and Communications publishes what they call input‐output tables (Figure 1). They represent the connections between goods and services purchased, produced, and sold among various industry sectors. For example, as electrification advances, household power consumption will increase, requiring power companies to increase their generation capacity, which in turn will necessitate an increase in fuel. This change will in turn impact the fuel industry. The tables illustrate the economic chains amongst these various industries in monetary terms.
Figure 1: Conceptual diagram of an input‐output table
(Joint Compilation)
Minagawa: So, the tables provide a dynamic insight into how changes in one industry spill over to other industries, along with changes in economic structure?
Ishikawa: The tables are prepared every five years, and our study was based on the 2015 table. It summarizes the value of 509 goods amongst 391 purchasing sectors. Here, we have created a unique extended input‐output table by establishing a new renewable energy sector that did not exist before, selecting goods of interest from the perspective of CO2 emissions, and ultimately narrowing it down to 173 goods for 173 sectors.
Nishikawa: To make subsequent analysis easier, we formatted the extended input‐output table as a square matrix, but creating it was truly labor‐intensive. We have developed a conversion system at LCS that takes into account the correlation coefficients between sectors while adding new industries to the existing 509 sectors or refining the details of the sectors of interest, eventually integrating them into the 173 uniquely defined sectors. Thanks to this, the table has now become much more accessible and easier to analyze and understand.
Forecasting changes in industrial structure and enabling calculations of CO2 emissions
Minagawa: I understand you can calculate social changes in monetary terms, but how do you examine CO2 emissions?
Nishikawa: We utilized the Embodied Energy and Emission Intensity Data for Japan Using Input‐Output Tables (3EID) data book, which shows greenhouse gas emissions and energy consumption, and created a CO2 emission coefficient table by comparing it with the extended input‐output table. By introducing changes in industrial structure predicted to occur in the future and changes considered necessary for ZC measures, we can calculate CO2 emissions and GDP, among other factors.
Minagawa: So, you change the conditions according to the desired future scenario and obtain the results from the calculation. The conditions used must be critical.
Yamada: For example, the power demand in 2015 was 1,000 terawatt‐hours (TWh) but considering the increase in power demand due to electrification, we estimated 1,200 TWh for 2030 and 1,800 TWh for 2050.
In order to increase the supply of electricity from 100 percent renewable energy in 2050, more wind power will be used, but the main source of power will be more solar power. With these conditions, the CO2 emission reduction rate will reach nearly 44% by 2030, almost achieving the current national target. However, since it remains at 80% in 2050, achieving 100% will eventually need to be achieved by capturing CO2 from the atmosphere using Direct Air Capture (DAC). In the case we calculated, the GDP results were 595 trillion yen for 2030 and over 700 trillion yen for 2050. Since the 2015 GDP was 533 trillion yen, achieving a ZC society while increasing the GDP is possible.
Ishikawa: There are various calculation methods, such as using past rates of change or setting optimistic target values like 100% electric vehicle (EV) adoption. The scenario changes depending on what you want to evaluate. In this study, we focus on GDP and CO2 emissions, create multiple unique scenarios tailored to the desired goals, and publicly present the results of those calculations.
Hopes for the Tourism and Information Service Industries Whilst Also Expanding the Education Sector to Increase GDP
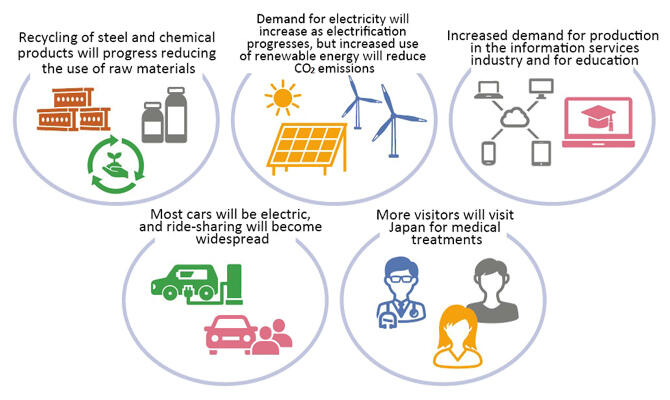
Nishikawa: In the study, we chose 10 sectors to focus on and made changes to them. They included sectors with high CO2 emissions, such as power generation, steel, and automobiles. From a GDP perspective, we also selected the information service and tourism industries, which will see future growth.
Yamada: The introduction of renewable energy will be accelerated by increasing electrification, reducing the demand for gas and kerosene, and increasing the demand for electricity. Amongst steel and chemical products, recycling will increase and production itself will decrease. In addition, the high level of medical care in Japan will be utilized to increase the number of medical tourists. Furthermore, amongst industrial equipment, Japan has strengths in the production of turbines for geothermal power generation, which will be further extended to increase exports (Figure 2).
Figure 2: Examples and scenarios for possible industry changes in the lead up to 2050
Minagawa: Which sectors will see particularly striking changes?
Ishikawa: The information services industry. Do you shop online?
Minagawa: Yes, I use it often.
Ishikawa: I believe that in the future, trading on the Internet will flourish more dramatically than it does now. We calculated the results under the condition that sales of equipment and software in the information services industry increase, and household education expenditures also increase.
Yamada: If the information services industry experiences explosive growth, power demand will increase accordingly. We changed some coefficients and calculated that it is possible to supply over 3,000 TWh of power, three times the current amount, by 2050, with the cost remaining unchanged at 25 yen. In this case, the GDP can reach around 1,500 trillion yen, allowing for 3% annual economic growth.
Minagawa: So, it's possible to envision a path forward where ZC and economic growth can coexist. What else is needed to make this path a reality?
Yamada: There are individual efforts towards decarbonization, but the overall picture of the society we should aim for needs to be shared. To do that, we must effectively communicate the research results from LCS. Also, it is crucial to increase the number of people receiving higher education and foster talent in science and technology. Increasing household expenditures in the education sector and related social expenditures will also contribute to GDP growth. This is evident from the input‐output calculations.
Minagawa: So, nurturing the talent that supports technology and industry is also essential.
Yamada: Education is crucial for Japan's future. To pass on a bright and affluent future to coming generations, creating a society where capable individuals can demonstrate their abilities is vital.
Minagawa: This interview has made me aware that realizing decarbonization requires technological developments and the skillful creation of social systems. I need to consider how my company's business can contribute to this goal.
* This is a fictional narrative based on an interview.
(Text by Akane Iwasaki, and photos by Seiko Kusunoki, Junko Kiriyama)